
Planning your next move without sizing up the opportunity is like setting sail without a map. Whether you're expanding into new regions, launching a product, or validating an idea for investors, market sizing helps you understand the playing field. It turns guesswork into strategy by showing how much demand exists and where the real opportunities lie. And with tools like GWI, you can skip the assumptions and start with real-world data.
What is market sizing?
Market sizing is the process of estimating the potential demand for a product or service within a specific market. It gives you a sense of how many people you could sell to, how much revenue that might generate, and how large your slice of the market could be. This isn't just a number for investors. It’s a foundational step in building a scalable, insight-led strategy.
Why market sizing matters
For decision-makers, market sizing does more than just quantify opportunity. It sharpens focus. When you're entering new territories or rolling out new products, you need a clear view of who your customers are and how much value you can create. Done well, market sizing shows whether an idea is worth pursuing, helps prioritize resources across teams and regions, supports pricing and positioning decisions, and strengthens pitch decks and funding proposals. Whether you're validating product-market fit or entering a competitive space, having these numbers makes your next step smarter and more grounded.

Market sizing methods: Top-down vs bottom-up
There are two primary approaches to market sizing: top-down and bottom-up. The top-down method starts broad. You look at the total market and estimate your share based on industry averages or competitor data. It’s fast but risks being too optimistic without careful refinement. Bottom-up sizing, on the other hand, builds from what you know. It uses actual data on your pricing, audience behaviors, and reach to calculate what’s realistically attainable. It's more accurate, especially when you're dealing with niche markets or new product categories.
TAM, SAM, and SOM explained
Understanding market size is easier when you break it down into layers. That’s where TAM, SAM, and SOM come in. These models help you go from the big-picture view to the opportunity you can actually capture.
What is TAM?
TAM stands for Total Addressable Market. It’s the maximum revenue opportunity if you sold to every single customer in your market. Think of it as the ceiling. To calculate it, multiply the total number of potential customers by the average value of a sale.
What is SAM?
SAM is your Serviceable Available Market. This is the slice of the TAM you can actually serve based on your distribution, targeting, product fit, or regulations. To calculate SAM, narrow down the TAM by filtering it through criteria like audience relevance, channel access, or regional capabilities.
What is SOM?
SOM is your Serviceable Obtainable Market. This is the portion of SAM you can realistically capture based on your marketing reach, budget, and competition. It’s the most actionable layer for forecasting and building out growth plans.
How to calculate market size step-by-step
A solid market sizing approach follows a clear path. Here's a basic structure:
1. Define your target audience
Get clear on who your product is for. Combine demographic, behavioral, or attitudinal data to build a profile that reflects actual potential buyers.
2. Gather key market data
You need hard facts on pricing, purchase frequency, and product categories. Tools like GWI let you dig into real spending behaviors and consumer intent.
3. Choose your sizing method
Top-down gives you a high-level view, while bottom-up builds from actual numbers. Often, blending both approaches gives the most complete picture.
4. Run the numbers
Plug your data into the relevant formulas. Multiply audience size by spend per customer or expected purchase volume. Adjust for reach, marketing, or product limitations.
5. Validate your assumptions
This is where tools like GWI Spark shine. Ask questions in plain language and get survey-backed insights you can use to pressure-test your model.
6. Adjust for segmentation
Use filters like region, behavior, or attitudes to create different sizing models. This helps you localize your strategy and refine messaging or spend.
Common mistakes in market sizing
Market sizing is only as good as the thinking behind it. A few common pitfalls include overestimating your total addressable market by ignoring real-world limits, forgetting to factor in competition or market saturation, using broad population stats instead of segment-specific data, confusing potential market size with current market share, and failing to validate your model with actual behavior or spending data.
Market sizing example: Expanding a whiskey or wellness brand
Let’s say you’re a whiskey brand looking to grow in Latin America. Using GWI, you start by building an audience of whiskey drinkers based on recent purchase behavior. From there, you segment by region and country, and see how large each audience is in the real world. You identify which regions have the most interest, then layer on brand engagement and purchase intent to pinpoint where your campaign will land best.
Now take a wellness brand exploring growth in the US. With GWI, you can track supplement usage trends over time and compare product interest by city or region. You can also layer on values like sustainability and wellness to find which audiences are ready to adopt new formats. This lets you confidently assess whether prebiotics, for instance, are trending up or flatlining.
In both cases, you’re not relying on gut feel. You’re using verified consumer insight to make strategic moves.
When to use market sizing
Market sizing is useful any time you're evaluating direction or risk. That includes entering new regions, validating a product idea, prioritizing audiences in a competitive space, building out pitch decks, or deciding where to invest time and budget. It’s especially powerful when resources are limited and the margin for error is tight.
How GWI helps with market sizing
GWI gives your team the tools and data to size markets quickly and accurately. You can build custom audiences based on behaviors, values, or intent, then see how those audiences vary across 50+ global markets. Use segmentation to break audiences down by region, age, interest, or attitude. Track demand shifts using historic data. And when you need fast answers, GWI Spark is your shortcut. Ask a question and instantly get survey-backed insight from nearly a million consumers. It’s trusted by sales, product, and strategy teams looking to make smart moves, fast.
How to calculate market size and identify expansion opportunities with GWI
We’ve covered the basics of how to calculate market size. Now it’s time to go deeper. This is where GWI steps in, turning that general outline into a practical workflow built on real consumer data and instant insights. Here’s how to do it using GWI.
A step by step guide to understanding audience and market size
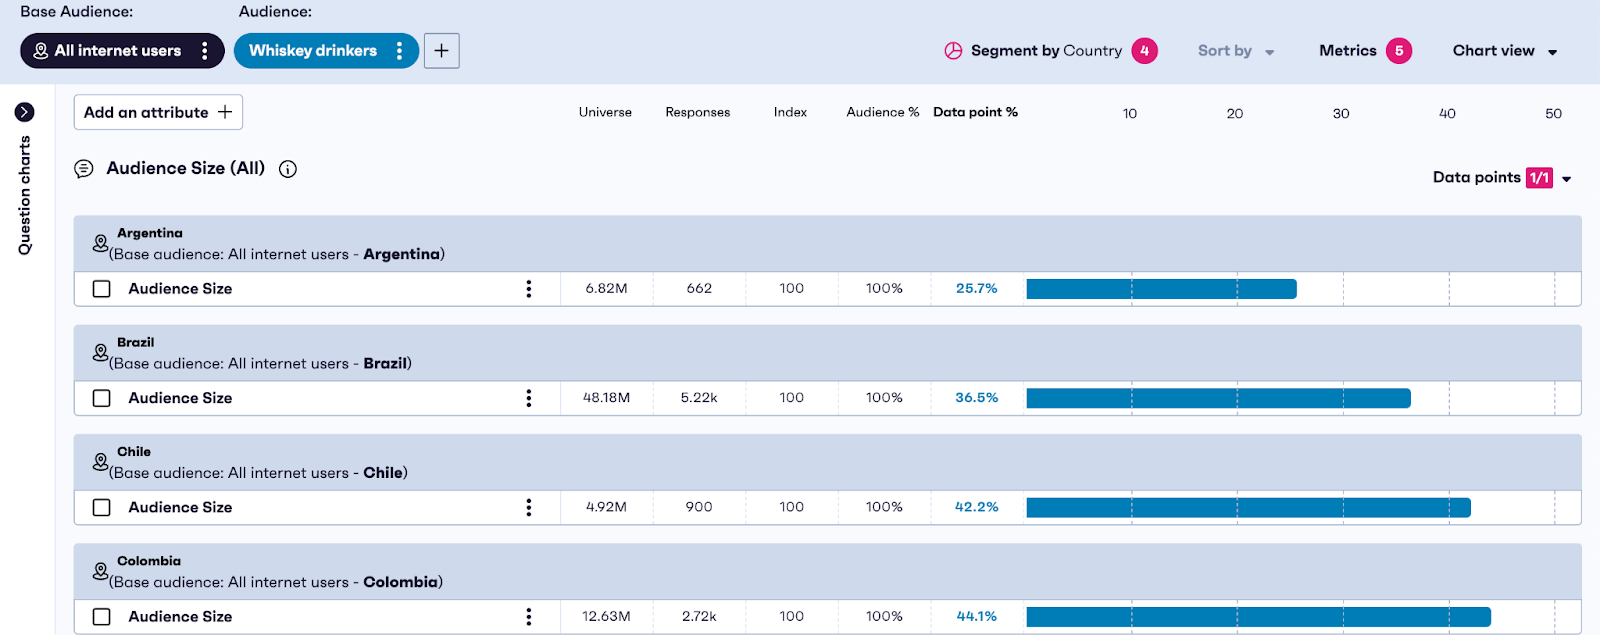
Say you’re a whiskey brand looking to check what market is the best bet for your brand to expand into. Here’s how simple it can be with GWI.
- Create an audience.
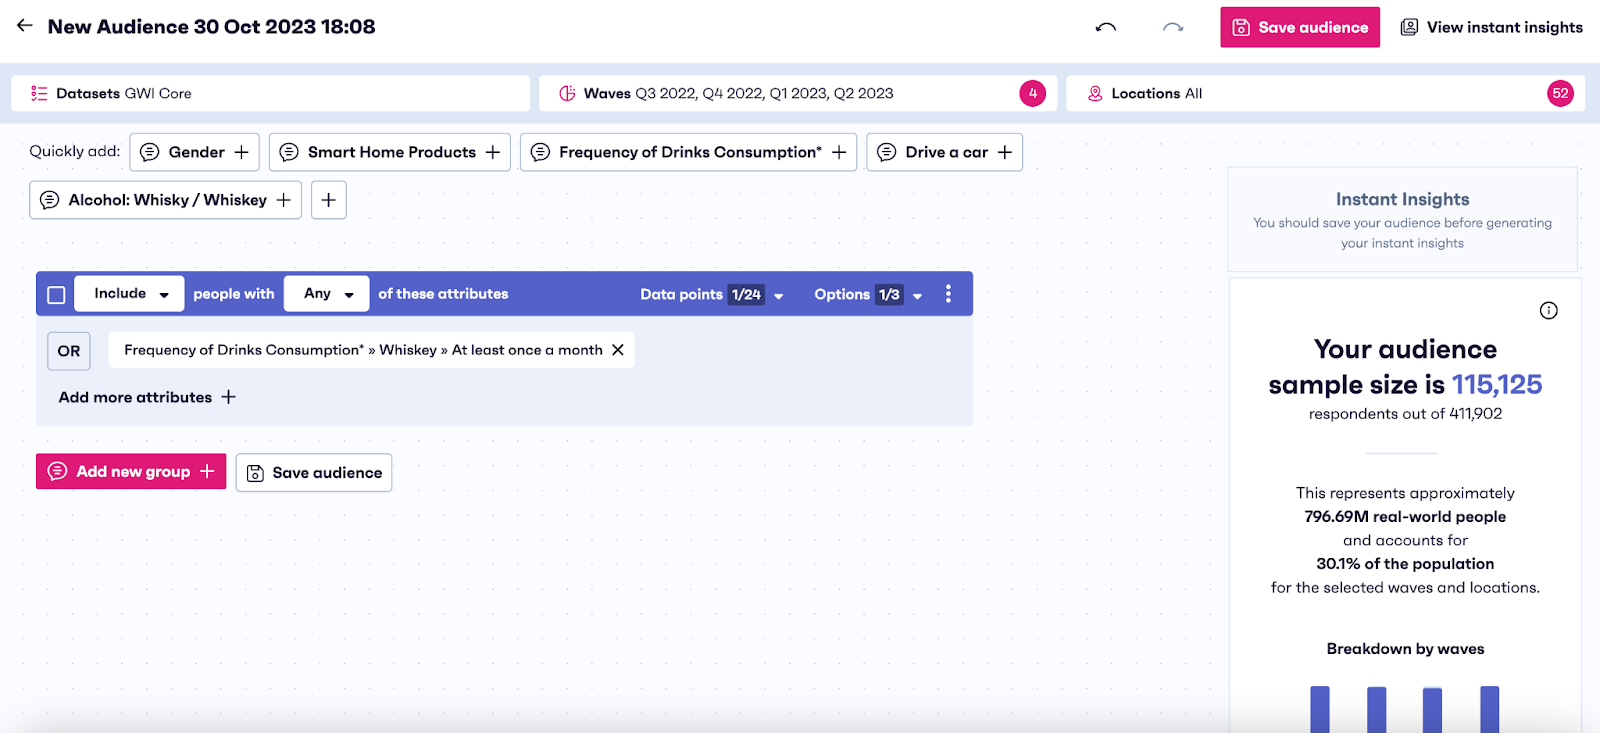
The first step is building your audience. Here you should really be looking at product purchasers, those who’ve either recently or are planning to purchase a product, or those who engage with a behavior regularly – for example those who drink alcohol.
When you define your audience, you can open the audience size question and apply the audience here. This will give you the total audience size globally, which is 115,125 million whiskey drinkers (correct as of November 2023).
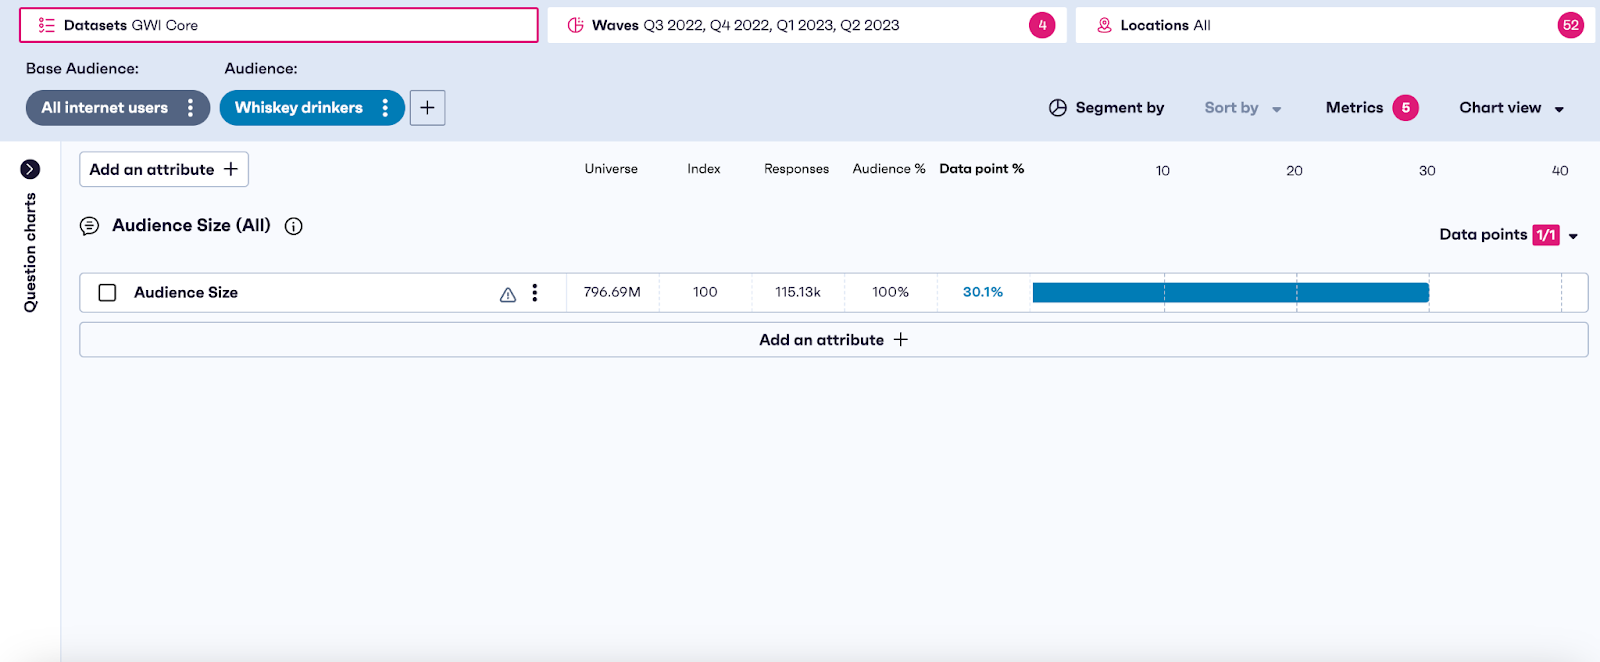
2. Begin building your chart
So now you want to see which country has the highest percentage of whiskey drinkers. Head to charts, apply your saved audience of whiskey drinkers, go to “add attribute” and select “audience size”.
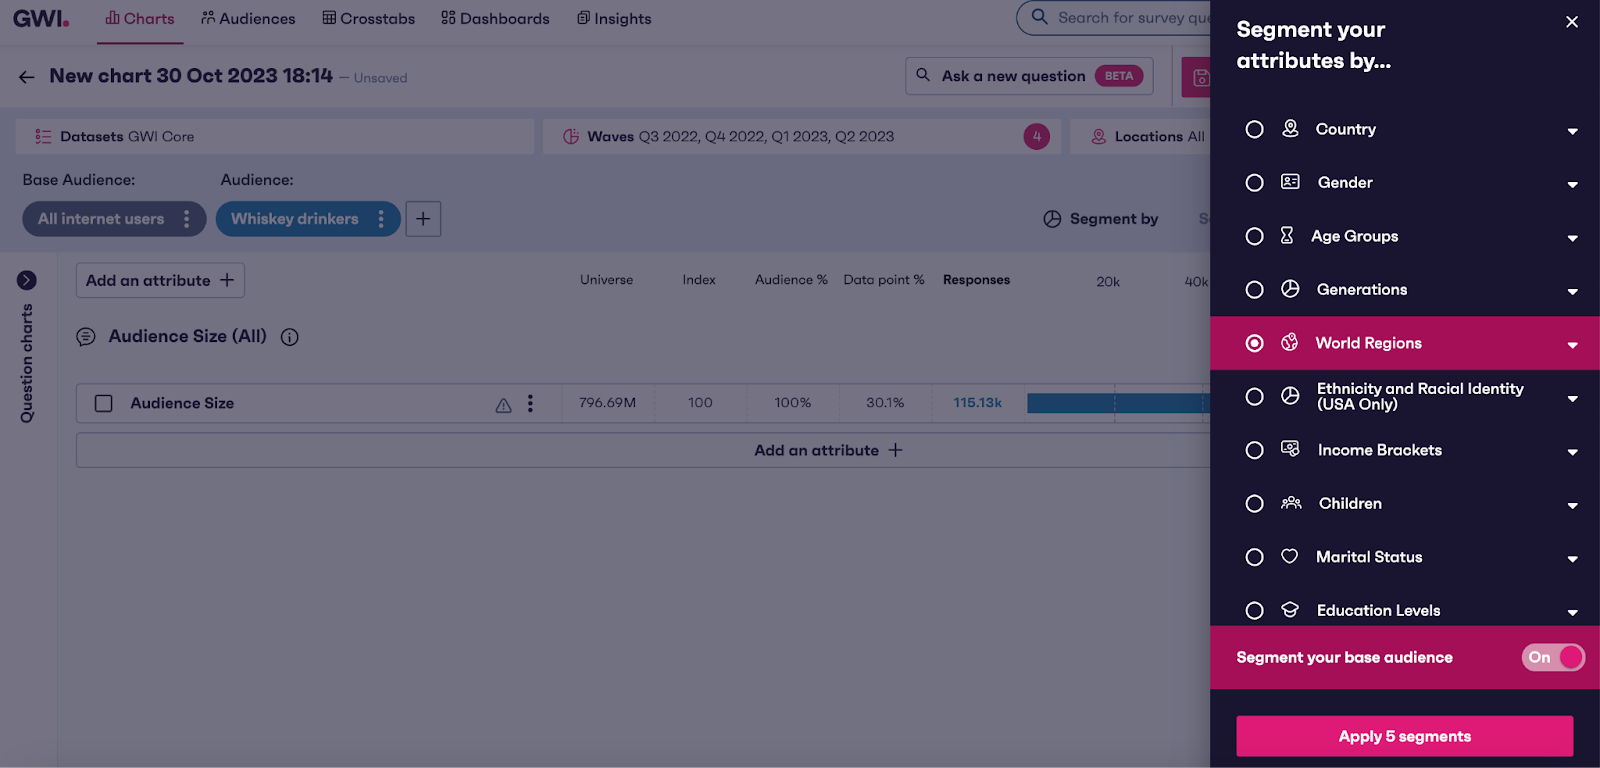
Then go to “Segment by” and select “By world region”. Make sure you click “On” where it asks you whether you want to segment your base audience.
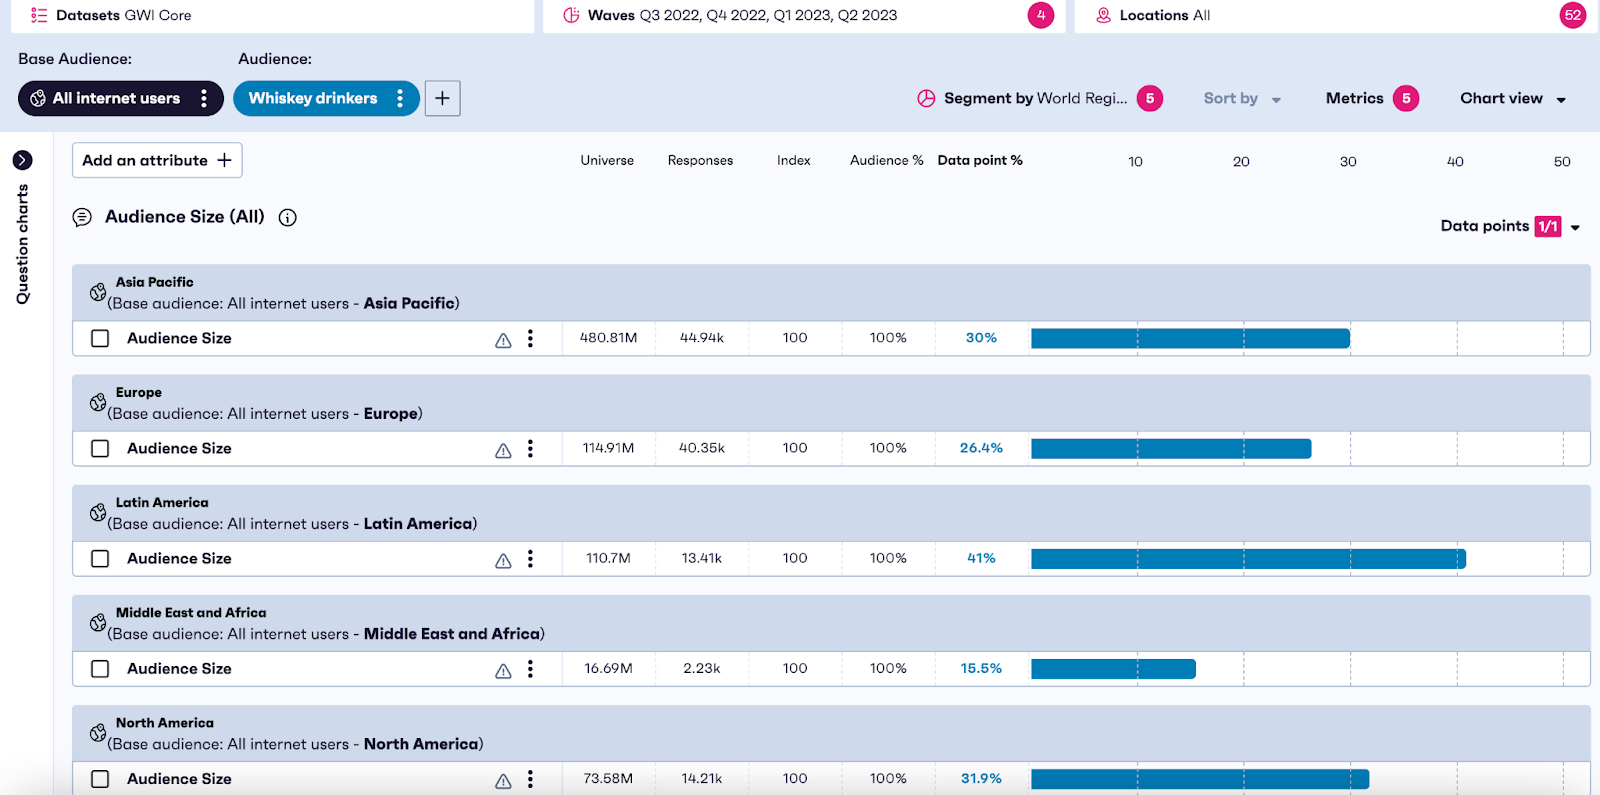
3. Refine by region
Here you can select segment your base audience and look at the data point percentage to see which country has the highest amount of whiskey drinkers – here we can see that it’s Latin America with 41%.
4. Drill down by country
Latin America is a pretty broad region, so it’s time to get specific. Here, you need to remove the global region segment and change the location to Latin America. Now segment by country.
Now we can see the percentage of whiskey drinkers in each country – and, just like that, the best market to expand into with your whiskey brand.
5. Dive into your new audience
Now you’ve got your audience, you can begin to dig deeper into their consumption habits, brand engagement and attitudes, and marketing touchpoints to start building out your strategy.
Utilizing global trending data to predict market direction and purchase intention
Let’s say you’re a successful wellbeing company with a range of gut health products. You’ve got a line of digestive health supplements that are doing incredibly well in the UK, but you’re ready for transatlantic growth. You’ve seen a number of US influencers promote health supplements, but you want some hardcore data to back up your launch.
When taking a look at this data, we can see that the percentage of Americans who say they take health supplements has gone from 12% in Q2 2020, to 16% in Q2 2023. That’s a pretty good case for your brand.

30% increase (from Q2 2020 to Q2 2023)
In fact, the gut health market seems so strong, you’re considering trialing a line of kombucha in the US. So you dig into the data.

If you were to compare the Q4 2022 to Q1 2023, you might think there’s a growing trend at play. But when you zoom out and see historical trending data, you can tell it might not be the right time. In fact, those drinking kombucha have been fluctuating since Q2 2020, but you wouldn’t have discovered the volatility without viewing interest on a historical timeline.
GWI in action: How Blizzard Entertainment drove growth across regions
Blizzard Entertainment is a leading entertainment software developer and one of the most popular and well-respected makers of computer games.
Commercialization is at the very top of their agenda, based largely on creating effective partnerships. To drive this, the brand needs to craft compelling, data-rich narratives that show how Blizzard and its esports audience are worthy of investment.
When an opportunity arose with a leading US-based snack brand, Blizzard’s sales team needed to prove their esports audience had an interest in buying the snack.
To do that they needed a story that stood out and was supported by hard data. The difficulty was their existing understanding was missing the vital global view.
Blizzard set to work leveraging GWI data to show how esports fans across key markets really felt about the snack brand in question.
As Alan Lan, Strategy & Analytics Manager for AB Esports at Blizzard, puts it, “The data on purchase intent and consideration was especially valuable. It proved we weren’t making assumptions and that our recommendations were based on fact.”
Using GWI data, Blizzard were able to say exactly how many of their esport audience used the snack in each category, along with how this compared to their competitors and the overall market size.
The result showed the true market potential of the partnership, offering quantifiable proof to justify long-term investment.
As a result the snack brand signed a sponsorship deal for Blizzard’s prominent Overwatch League, followed by a multi-year partnership that opens the door to even more future growth.
Why market sizing matters
Market sizing helps new and expanding businesses to:
- Get a broad understanding of their audience and market trends based on up-to-the-minute data
- Assess the demand for a product or service, both in general and in light of new trends events
- Understand audiences in detail, so brands know exactly who to target, which channels to use, and who to ignore
- Use a data source that provides instant, authoritative answers on audience numbers, both globally and in specific markets
Market sizing FAQs
What is market size?
Market size is the total number of potential customers for a product or service, along with the revenue those customers represent.
What’s the difference between market size and market share?
Market size looks at total opportunity. Market share is how much of that opportunity your brand actually owns.
How do you calculate TAM?
Multiply the number of potential customers in the market by the average value of a sale to each customer.
What are common challenges in market sizing?
Some challenges include finding reliable data, overestimating the total addressable market, and ignoring important variables like behavior, competition, or regional constraints.


.webp?width=495&height=317&name=pink_thumb_graphs%20(1).webp)
.webp?width=495&height=317&name=pink_thumb_letter%20(2).webp)