In research, accuracy is everything. GWI’s data comes from real, verified people, asked the same questions in every market, and the presentation tools take you from findings to a finished deck without the formatting grind.

Data from real people, and a lot of it
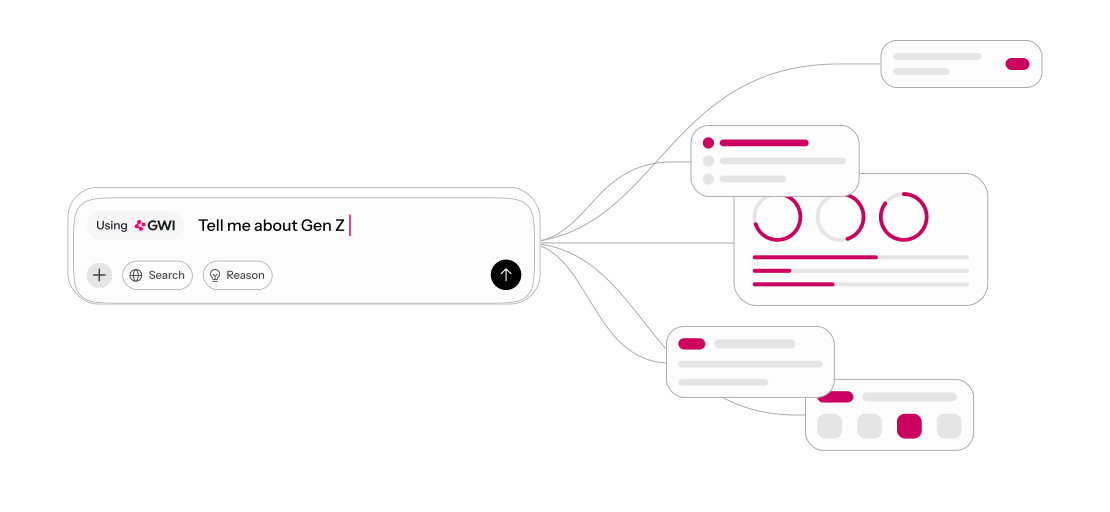
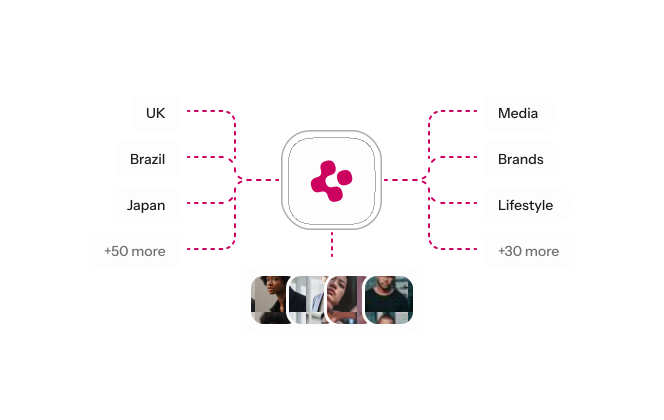
Every answer comes from a real, verified person, asked the same questions in the same way in 50+ markets, year after year. You can see where each number comes from and how it was collected.
Each figure traces back to the real people who answered, so you know who is behind it and how they were reached.
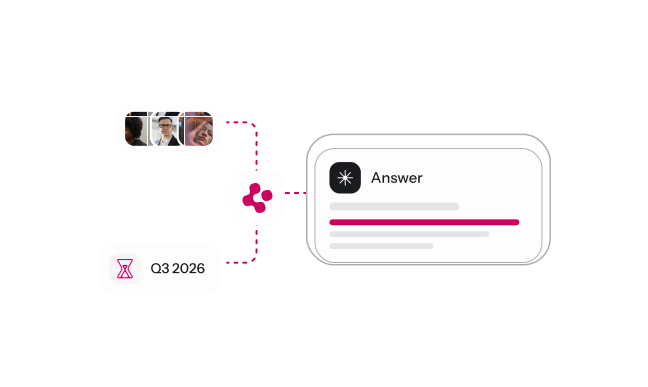
The same questions in every market and every year, so differences between countries and over time reflect real change, not a change in the survey.
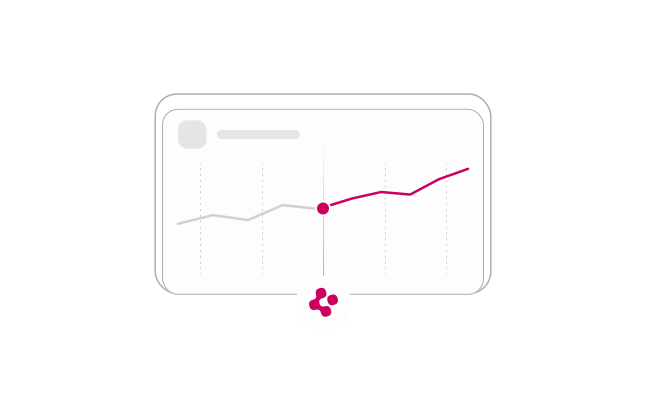
175,000 unique profiling points covering what people think, feel, do, and buy, so one source can answer questions you haven’t asked yet.
Built on real human data
Data points a year
45bn
Global markets
100+
Years of survey data
17
Survey responses a year
5.5m+
Go deeper with advanced analysis
Work with unaggregated data, connect it to your workflows, and analyze it in depth, with expert support behind you.
Ways to integrate
Bring GWI data together with your own first-party data, such as brand tracking, sales, and search, for a fuller view of your audiences.
Learn more
Respondent-level data
Get every answer from every respondent, so you can run your own analysis and trace any figure back to its source.
Learn more
Analysis tools
Cross-analyze, segment, and overlay audiences to see exactly how they differ.
Learn more
Test every hypothesis in minutes, with answers you can trace
Ask Agent Spark, GWI’s AI agent for audience insights, a question in plain language and get an answer grounded in 2 million+ interviews a year. Every figure shows the audience behind it, so you can validate an idea, check the base, and take it into the room.
From findings to a finished deck, without the formatting grind
Hours often disappear between a finding and something you can present: rebuilding charts, reformatting slides, matching the brand template. GWI’s presentation tools remove that step.
Charts in a few clicks
Turn a finding into a clear chart, switch views, and share it, with the data updating as new research lands.
Dashboards for the bigger story
Bring several charts and audiences together with your own commentary, and send clients a view-only version with no GWI login.
Decks, built with Canvas
Pick a goal and an audience, and Canvas builds an on-brand, data-led deck you can edit, with the metric and wave visible on every slide.