Turn what you learn about real audiences, from media habits to consumer trends, into charts, dashboards, and decks that tell the story - without altering what the data says. No design skills needed, and your decks come out on-brand and ready to present.
Getting people to act is the other half
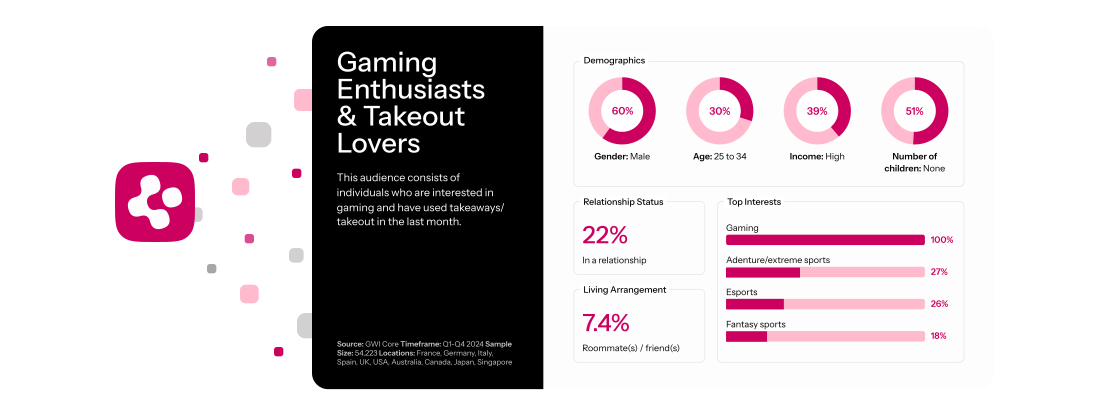
A broad audience label won’t persuade a room of senior leaders or a client you want to win. Specifics will: such as how Gen Z in Mexico splits its time across social platforms, or what pet owners in Spain say about premium brands.
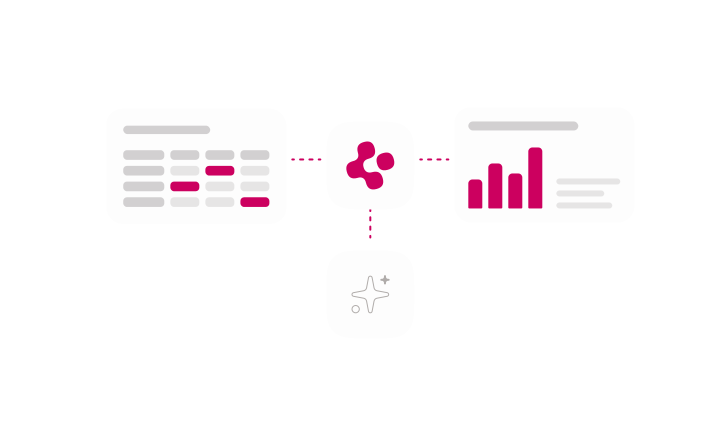
Turning findings like these into a story people can follow is a different skill from the analysis that got you there. GWI’s presentation tools help you do it easily. Build the story chart by chart, in a dashboard, or as a finished deck with Canvas, all from the same consistent survey data.
Choose the format that fits your story
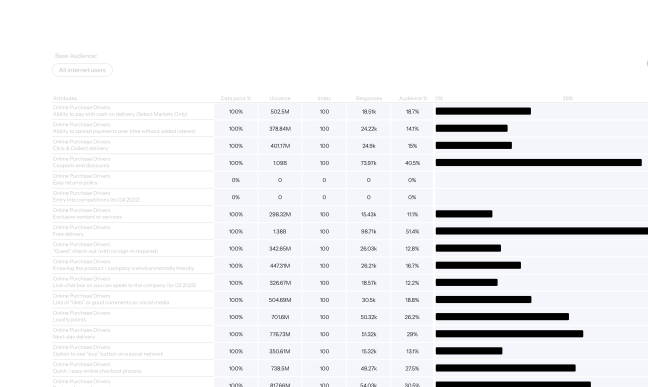
Visualize data with Charts
Charts turn survey data into something people can read at a glance. Show what an audience watches, buys, or believes, such as how often remote workers in Canada shop online. Switch between table, horizontal, and vertical views, and segment by age, market, time period, and more.
Charts update automatically as new research lands. Export or share in one click, with a colleague or your whole organization.
Tell the whole story with Dashboards
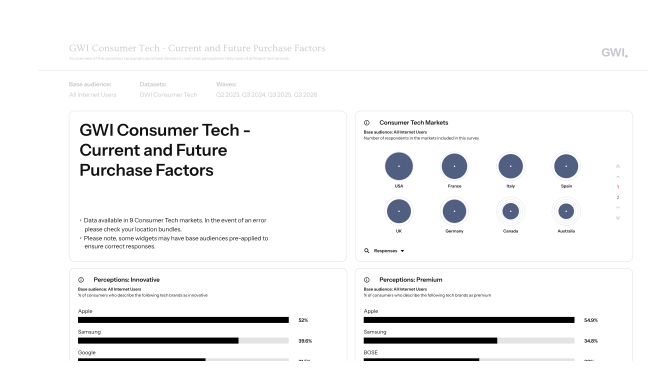
Dashboards bring several charts and audiences together, with your own text around them. Compare up to four audiences answering the same questions, such as how Gen Z, Millennials, Gen X, and Boomers in India shop online, or start from a prebuilt dashboard if you’re short on time. Share internally, send clients a view-only version (no GWI login needed), or export as PNG or XLSX.
Generate a finished deck with GWI Canvas
Pick a goal, like media planning or audience profiling, add up to three audiences, and Canvas generates a data-led deck. Every slide is editable and uses your brand’s colors, and you can create as many decks as you need.
Teams use Canvas to:
- Win pitches with evidence a prospect can check
- Build persona decks, such as a profile of fitness enthusiasts in South Africa, from demographics to media habits and attitudes
- Develop campaigns, from the big idea to individual assets
Why these outputs hold up
A good-looking deck that can’t survive a challenge is worse than none at all. Every chart, dashboard, and slide is built to stand up to questions.
Built on real people
Every finding comes from real survey responses: 5.5 million interviews a year across 100 markets, built to represent people in each market. No generalizing, no scraping, and always traceable to the audience behind it.
Always current
Data updates automatically, so the number on a slide matches the platform.
Easy to check
Every slide shows its metric and wave, so the people you present to can see the number behind the visual. Generic AI deck generators can’t say the same.
How presentation tools fit with analysis tools
Use analysis tools to work out what the data says. Use presentation tools to turn it into something others can act on.Need a fast answer instead of a finished chart? Ask Agent Spark, GWI’s AI consumer insights analyst, in plain language and get an answer grounded in survey data.
What customers have done with GWI

300%
Passion Digital grew organic visibility.

197%
Nextdoor increased web views, driving more ad sales.

46%
ONE Championship grew US viewership in six months.
Rated by the teams who use it
G2's Summer 2026 badges cover usability at enterprise, relationships at mid-market and user adoption at small business


Built for a closer look
Data points a year
45bn
Global markets
100+
Years of survey data
17
Survey responses a year
5.5m+
Frequently asked questions
What chart views can I choose from?
Table, horizontal, and vertical. Switch between them to find the view that makes your point most clearly, then export or share it in one click.
Can I share charts and dashboards with people who don’t use GWI?
Yes. Chart sharing is included on every plan, including free, and you can send a view-only dashboard to anyone outside your organization, no GWI login needed.
What happens if someone edits a chart I’ve shared?
Your original stays untouched. Recipients choose “Save as new” to make their own copy, so they can adapt it without changing yours.
How do I build a market research dashboard?
Start from scratch or from a prebuilt, keyword-searchable dashboard, then add charts and your own text. Compare up to four audiences, choose from five metrics, filter by wave and market, and export as PNG or XLSX.
How do wave filters and market selection work?
Wave filters default to the four most recent, so you start with current data and can widen the range anytime. For markets, view one or several at once. Multi-market views show an average across your selection.
What data does GWI Canvas use, and can I check it?
Canvas is built on GWI Core: real survey responses from consumers in 50+ markets. It’s privacy-compliant and never scraped or synthetic, and every slide shows its metric and wave, so anyone can check the number behind it.
Who can access Canvas, and is there a limit on decks?
Canvas is included on every plan, with no limit on decks. Every slide is editable and uses your brand’s colors. Plus and Pro add watermark-free export and let you save and revisit decks.