Build the audience you want to understand, then explore what they think, do and buy. Compare different groups, spot patterns, and see how many real survey respondents sit behind every result.
Get a clearer view of your audience
The people you need to understand rarely fit neatly into a ready-made segment. GWI lets you get more specific without losing sight of the numbers behind your audience, then explore it in as much detail as you need.
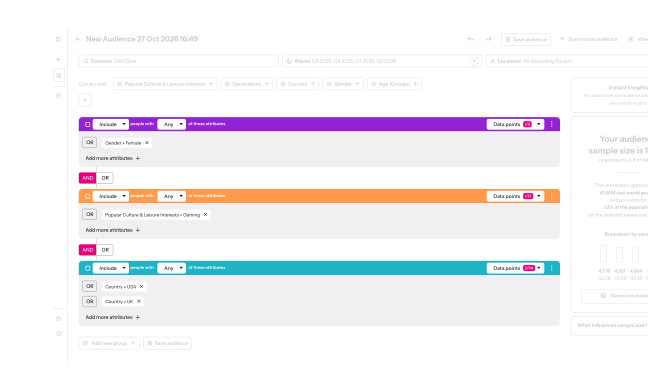
Build the audience you need
Start from scratch or take an existing GWI audience and make it your own. Combine characteristics across interests, attitudes, behaviours and buying habits to get as specific as you need. As you build, you can see how many real survey respondents sit behind your audience.
Book a demo
See how your audiences compare
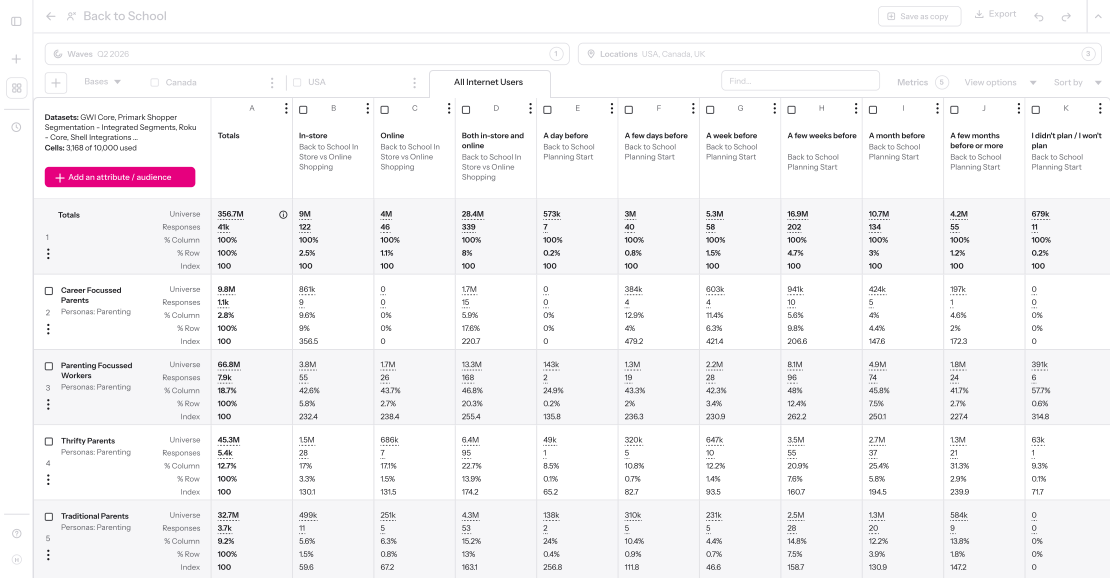
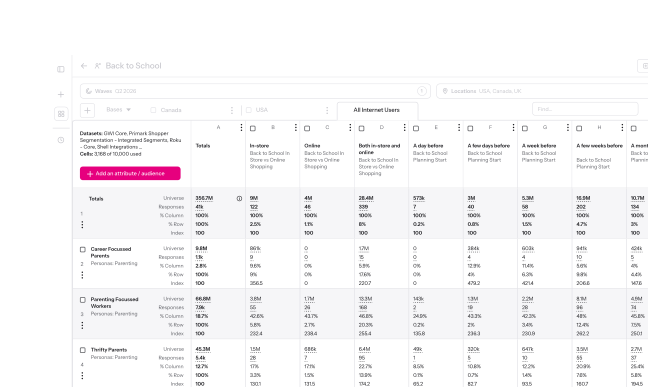
Crosstabs let you compare different groups and answers in one table.
Put the audiences you want to understand down one side, choose what you want to know across the top, and see where they differ, where they’re similar and where they do or don’t overlap.
Instead of checking one question at a time, you can explore several at once.
Compare audiences
Heatmaps
Templates
Filters
See where groups differ.
Compare several audiences at once and see where their behaviours, attitudes or answers do and don’t overlap.
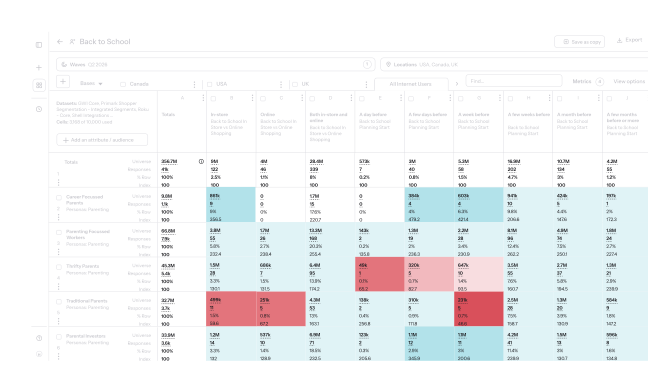
Make the differences stand out
Turn on a heatmap to make highs and lows easier to spot across a table of results.
Save the setup for next time
Save the way you’ve built a table, reuse it later or share it with your team instead of starting again.
Focus on what matters
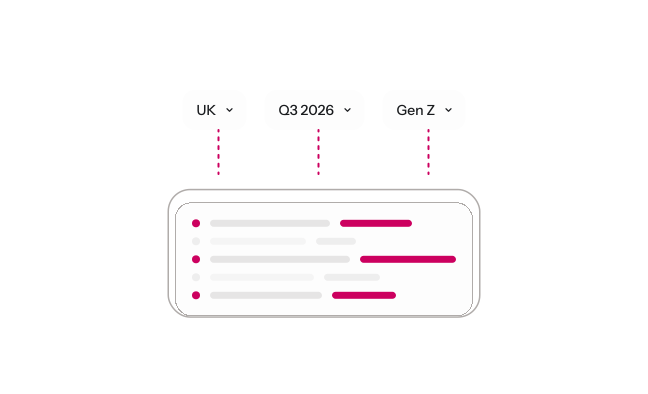
Narrow your analysis by market or time period and choose the exact group you want your results based on.
Numbers you can stand behind
Every audience shows how many real survey respondents sit behind it, so you can see what your result is based on.
Compare different time periods as the data updates, and export the full figures when you need to take the analysis further.
Take your analysis with you
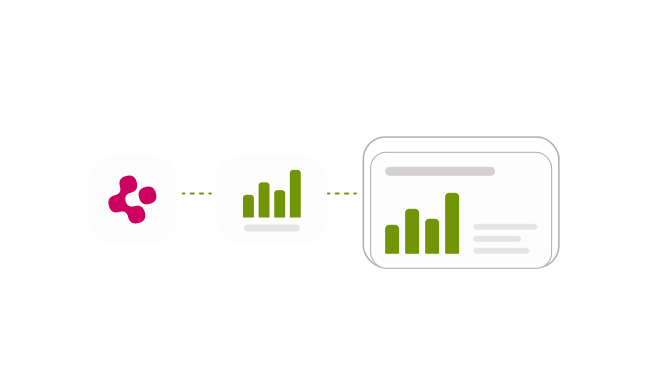
Save your work, share it with a colleague or make it available to the wider team.
Export results to a spreadsheet or PNG, add them to a dashboard, and leave notes so the thinking behind the analysis travels with it.
From quick questions to deeper analysis
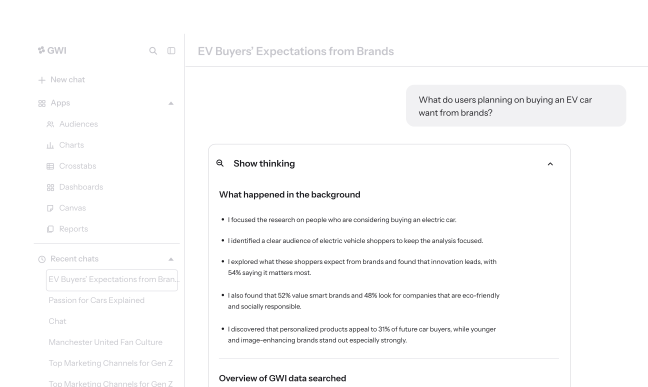
Agent Spark is great for quick answers but when you want to dig deeper, our analysis tools let you explore the data in more detail. Then turn what you find into charts, dashboards and presentations with our presentation tools.
Built for a closer look
Data points a year
45bn
Global markets
100+
Years of survey data
17
Survey responses a year
5.5m+
Got questions? We’ve got answers
What is Audiences?
Audiences lets you define the particular group of people you want to understand. Start with an existing GWI audience or build your own by combining the characteristics that matter to you.
How specific can I make an audience?
You can combine characteristics across GWI’s profiling data to create much more precise groups. As you build, you’ll see the respondent number change so you know how much survey data sits behind your audience.
What are Crosstabs?
A crosstab is a table that lets you compare different audiences against different answers at the same time. It makes it easier to see where groups differ, overlap or behave in similar ways.
Can I filter my analysis?
Yes. You can narrow your results by things like market and time period, so you’re looking at the part of the data that matters to your question.
Can I save and share my analysis?
Yes. You can save and reuse your work, share it with colleagues, add notes for context or bring your findings into a dashboard.
Can I export the results?
Yes. Results can be exported as a PNG or to a spreadsheet with the full figures included.