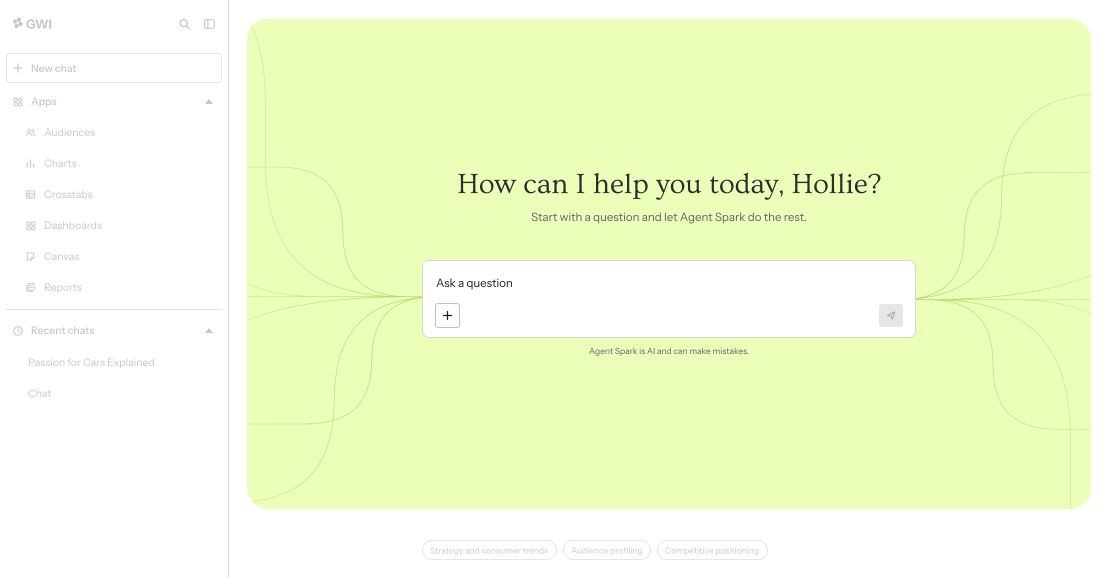
Build audiences, explore what people think and do, ask questions in plain language and turn what you find into charts, dashboards and presentations. All in one platform, built on survey data from real people.
From quick answers to deeper analysis
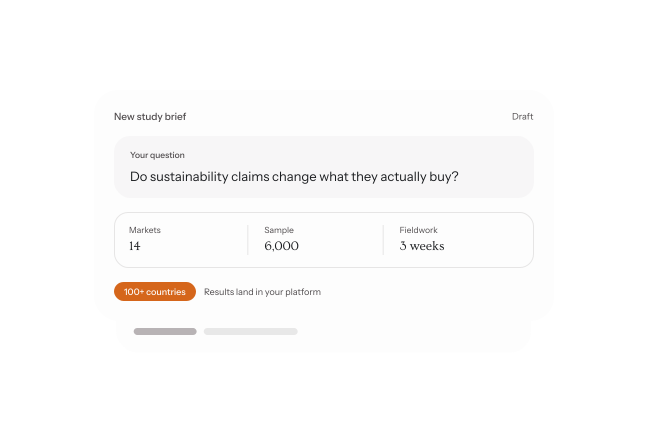
Plug GWI into your stack and it feeds the tools your team already runs. Hand us a brief and our researchers design the study.
The platform is for everything in between. The quick answer that still has to be right, and the proper analysis underneath it, in one place.
Agent Spark
Analysis tools
Breadth
Ask it like you'd ask a colleague
"Does my audience actually watch sport, or have we just been assuming?"
Type that. Get an answer from GWI survey data, not from an AI that goes off and makes something up. Good for killing an assumption early, or finding the thread worth pulling before you commit an afternoon.
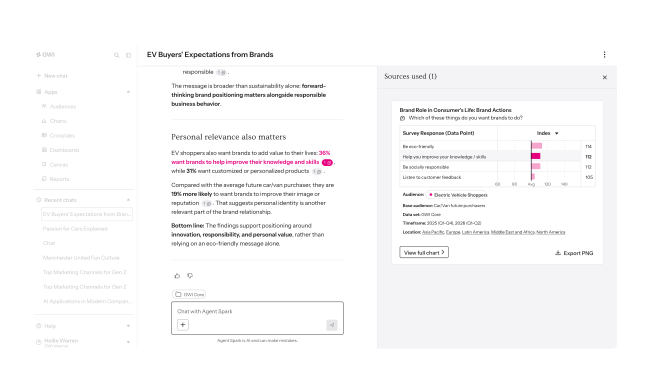
Get as specific as the question demands
Podcast listeners. Podcast listeners who bought a car this year. The ones who also say they distrust advertising.
Keep going, across 175,000 profiling points. Cross-analyze, segment, overlay data sets, and watch the respondent count as you narrow, so you know how much weight a cut will take.
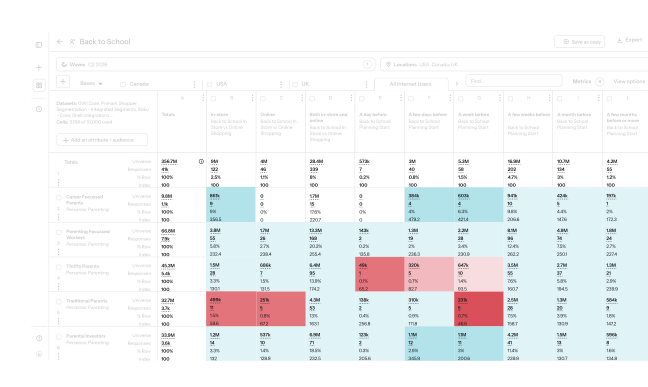
Make the claim and have it hold
Say that this group's environmental views shape what they buy, and know it came from one person answering both questions. The same respondents answer on attitudes, interests, media, brands and buying, so the link sits in the data rather than modeled on top of it.
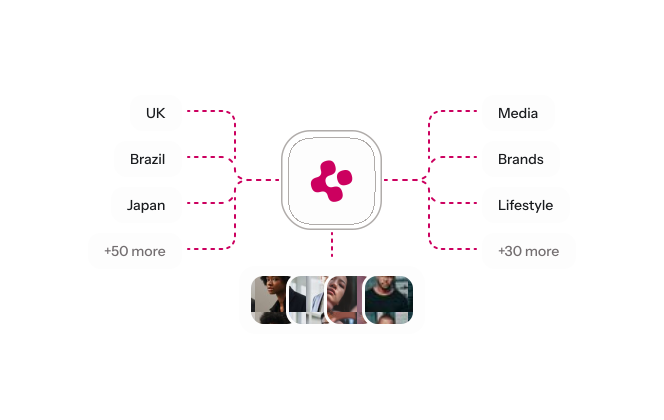
When a category needs more, specialist data sets go deeper into auto, gaming, consumer tech and travel. Same respondents, same methodology, more questions.
15+ years of it, asked the same way, so a trend is a trend.
Bring your key findings together
Turn what you find into clear, shareable outputs for whatever comes next.
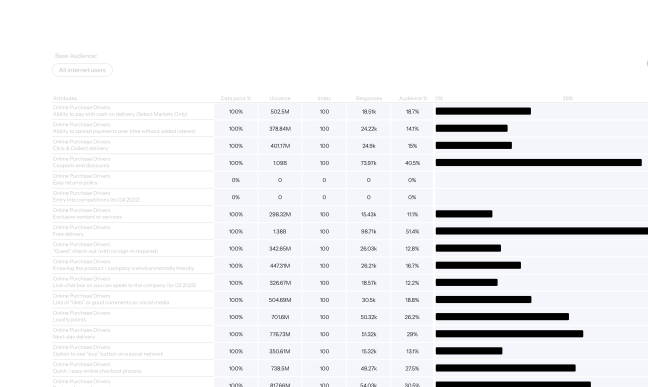
Charts
Make a single finding easy to understand at a glance.
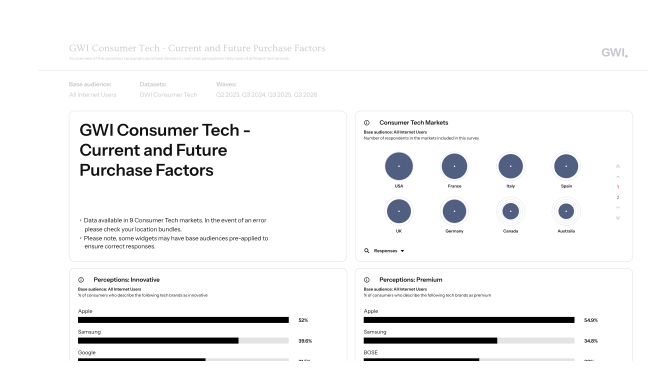
Dashboards
Bring related findings together so teams can explore and share the bigger picture.
Canvas
Turn your analysis into a presentation without rebuilding it somewhere else.
Grounded in real people
Data points a year
45bn
Global markets
100+
Years of survey data
17
Survey responses a year
5.5m+
Rated by the teams who use it


Got questions? We've got answers
What can I use the platform for?
Building and comparing audiences, analyzing behavior, asking questions in plain language, making charts and dashboards, and turning the lot into a presentation.
What makes it different from other consumer research platforms?
One survey, one respondent, every question. Most platforms blend sources, so the attitude data and the purchase data came from different people and the link between them is modeled.
Can I see how many people sit behind a result?
The respondent count is visible as you build, so you know before you present, not after.
Can I cross-analyze and segment?
Crosstabs give you a multidimensional view, so you can cut an audience against itself and overlay data sets.
How current is the data?
Most data sets refresh quarterly, some half-yearly. Pulse is collected daily and published weekly.
Will the rest of my team use it?
Yes. Dashboards and Agent Spark are designed for people who don’t live in the data, so teams can answer routine questions themselves instead of sending every request back to the insights team.
Can I get the data into our own tools?
Yes, through exports and our Platform API.
What if you don't have the data I need?
Our custom research services will go and get it.
Explore custom research