Your sales data tells you what happened. Ask GWI and you get the reason behind it, from 5.5 million people a year across 53 markets, in minutes rather than weeks.
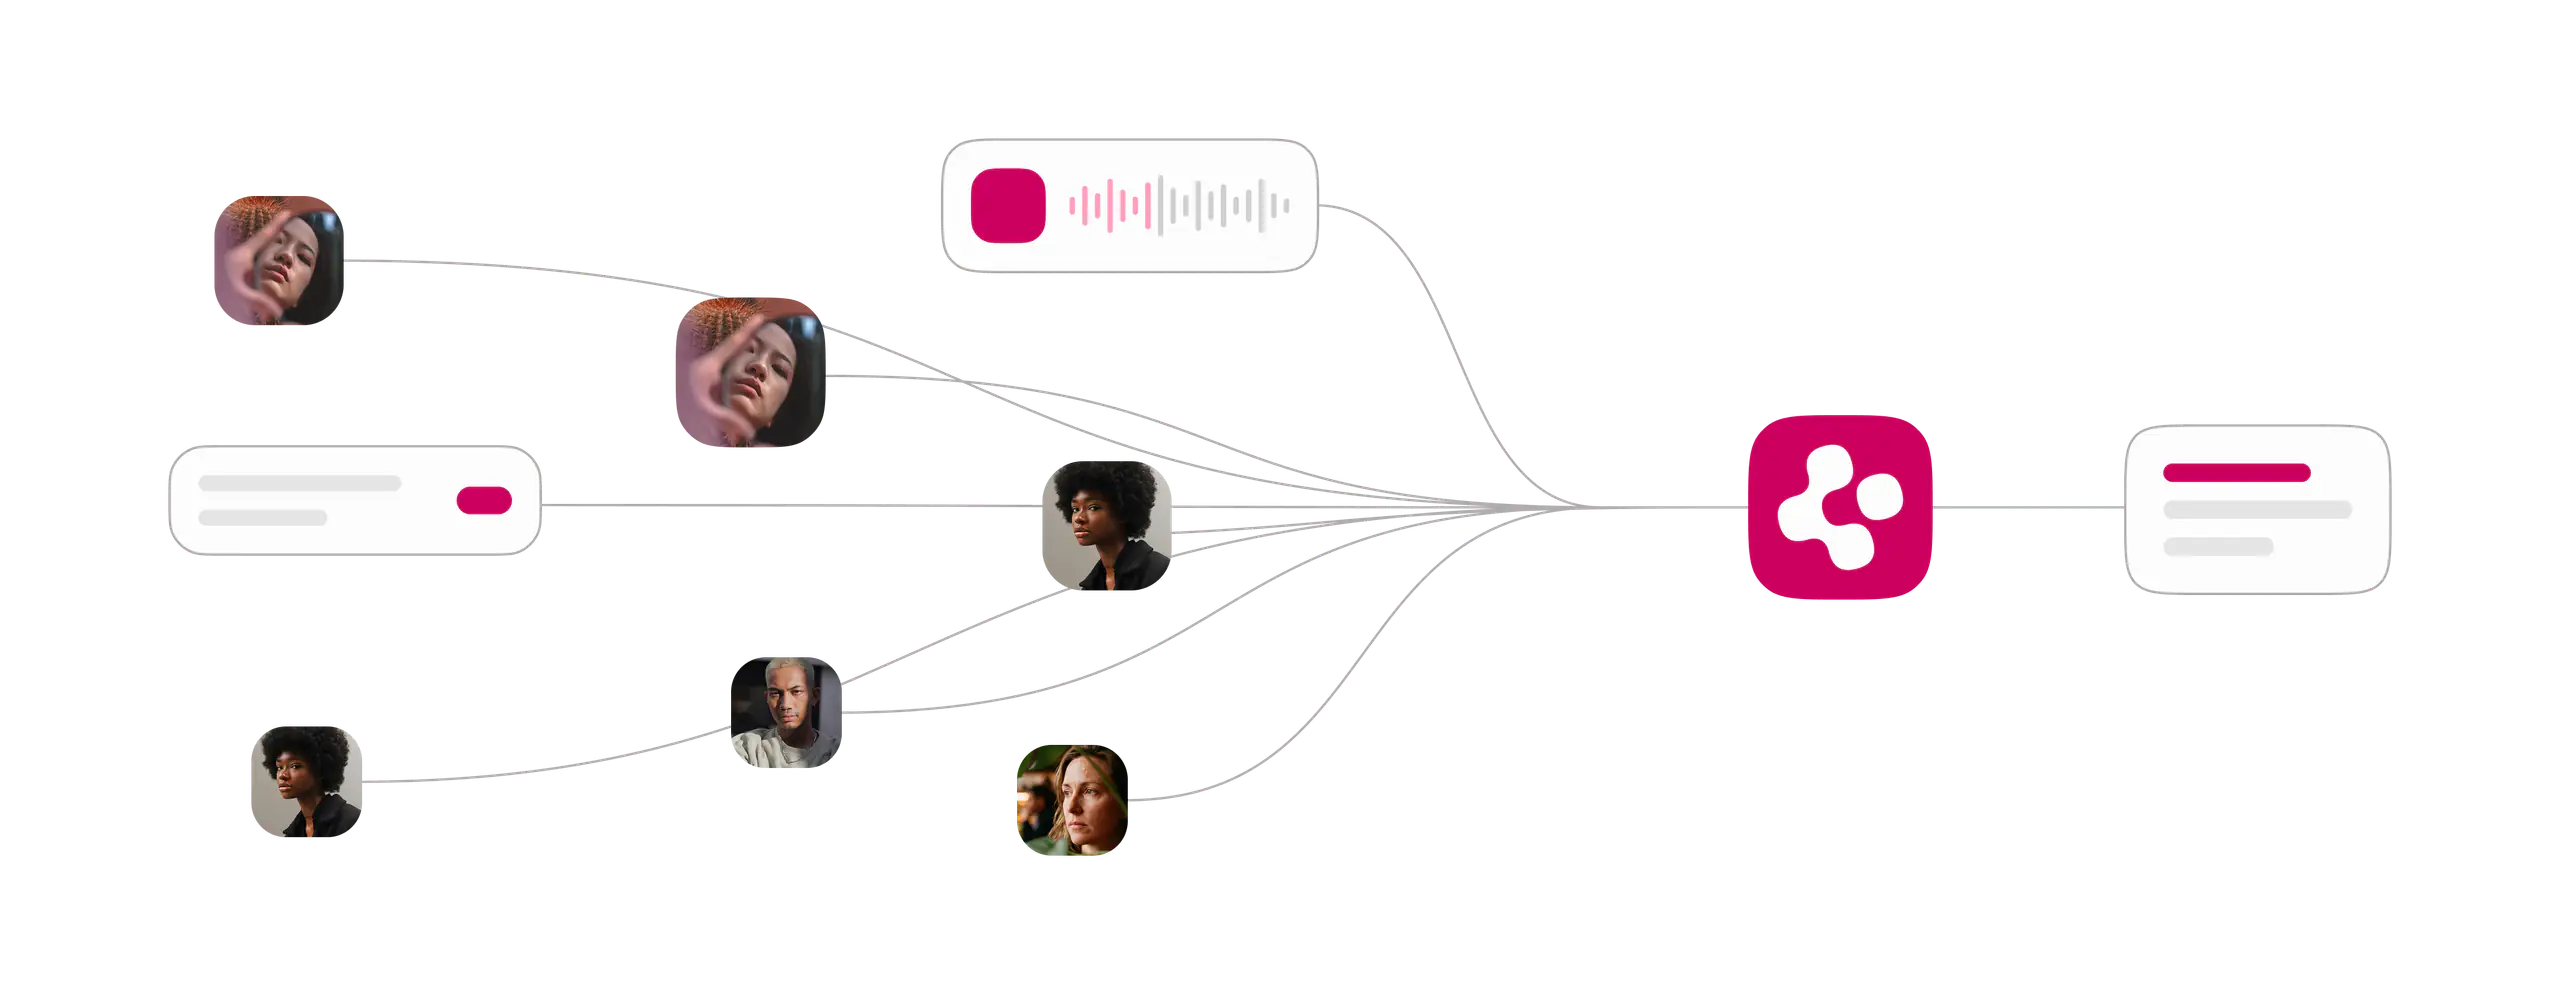
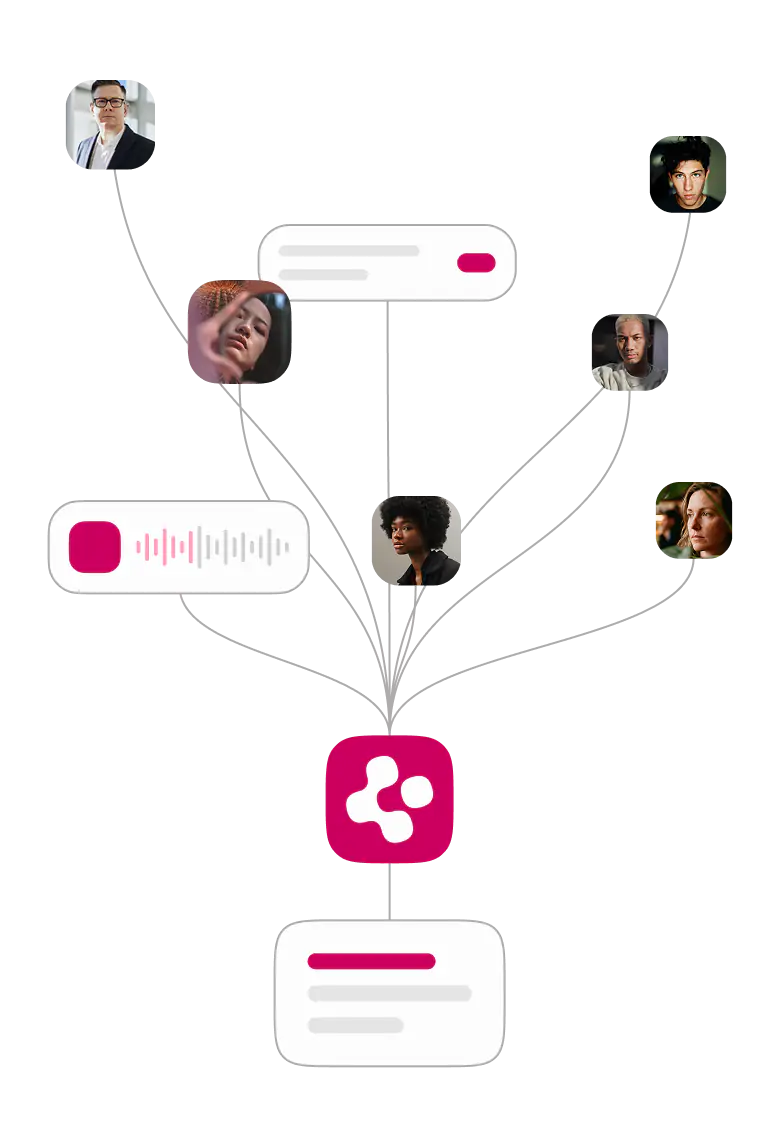
Every answer traces back to someone who told us themselves
Data points a year
45bn
Global markets
100+
Years of survey data
17
Survey responses a year
5.5m+
Try it before you talk to anyone
A short interactive tour. Put in a question, watch the answer come back.
How teams use GWI
Skip the two-week wait
The question comes up in a meeting. The answer arrives in the same meeting.
Walk in with proof
Numbers from a representative sample of real people, sized and sourced, so nobody in the room has to take your word for it.
Feed your own source of truth
One data set your whole team works from, instead of a folder of one-off studies that don't line up.
Move into a new market on comparable numbers
The same questions asked the same way in every market, so a read on Brazil means something next to your read on Germany.
Get to the motivation, not just the behavior
See what a group buys, then see what's driving it: what they care about, who they trust, what they'd pay more for, what makes them switch. Cut any audience out of 175,000 profiling points and compare it against the category, the competition, or the national average.
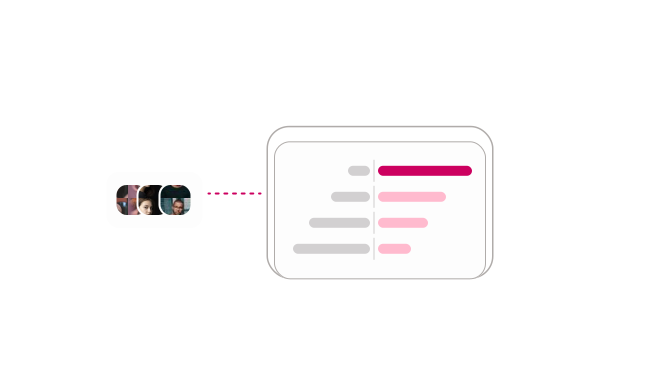
Ask the follow-up question yourself
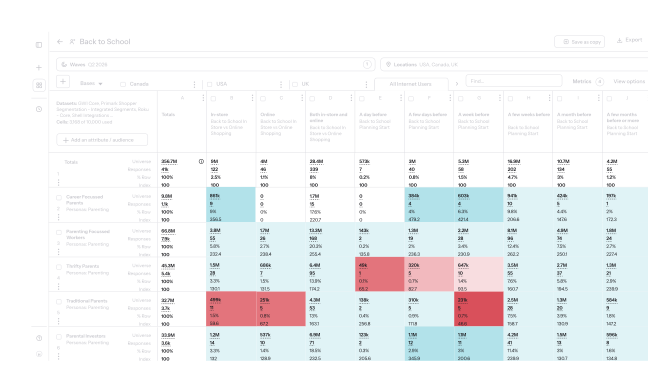
Crosstab analysis for when the first answer raises three more. Slice by market, age, income, or behavior, stack the groups side by side, and test the thinking before you commit budget to it.
Charts your stakeholders read without a translator
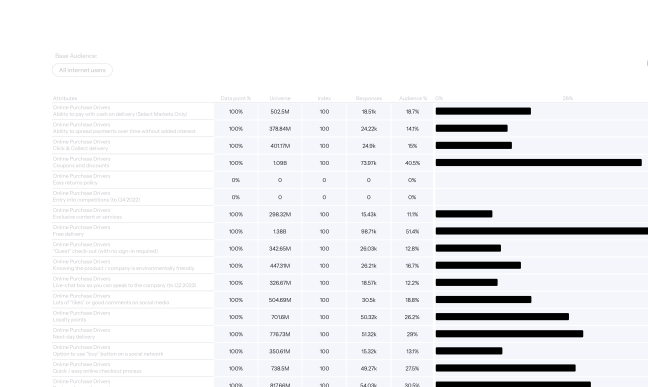
Turn a data set into a chart in a couple of clicks, then export it straight into the deck. The numbers stay legible, sourced, and comparable, so the slide survives the question that follows it.
Dashboards that keep everyone on the same numbers
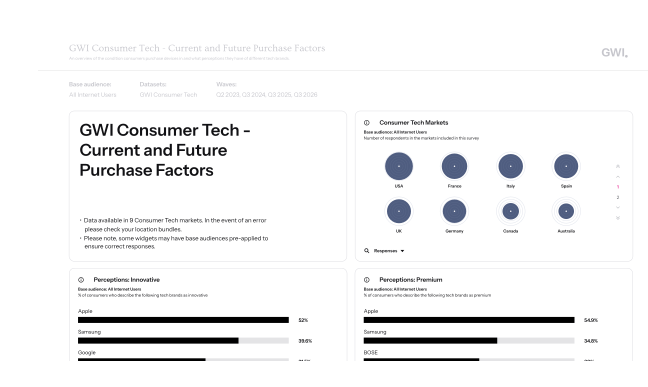
Build a live view for the team, the client, or the board, and let people pull what they need without coming through you. Refreshes as the data does.
Ask in plain language, get an answer back
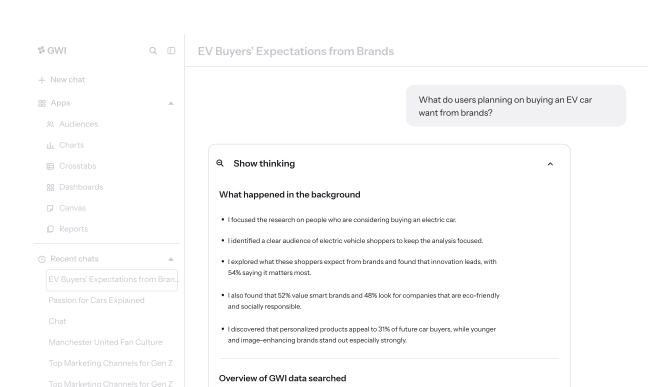
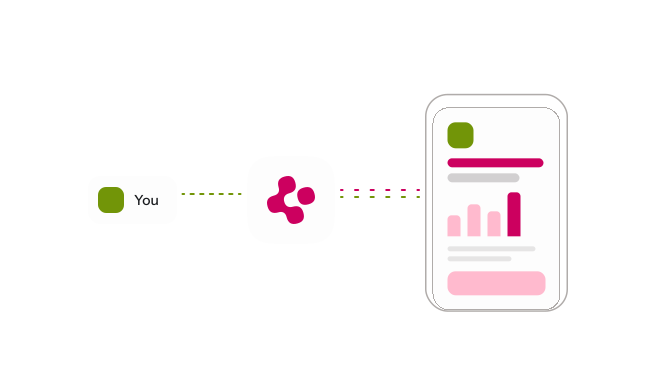
Agent Spark, our human insights analyst, sits on the same data set and answers in seconds. Ask it the way you'd ask a colleague, follow up, then take the answer into the AI tools your team already uses.








Thirty minutes, your questions
A working session with a platform expert using your categories and your markets, not a canned tour.
Answers to the questions you bring
A walkthrough built around your role
Use cases from teams like yours
Time to push back and ask your own